Visualizing a todo list with Treemaps
I frequently find that I'd like a high-level overview of the tasks on my todo list, but the OmniFocus list views can be unwieldy-- there may be too many items to see them all at once, and I sometimes find it hard to keep track of which items are most time-consuming and/or most urgent (overdue, or flagged).
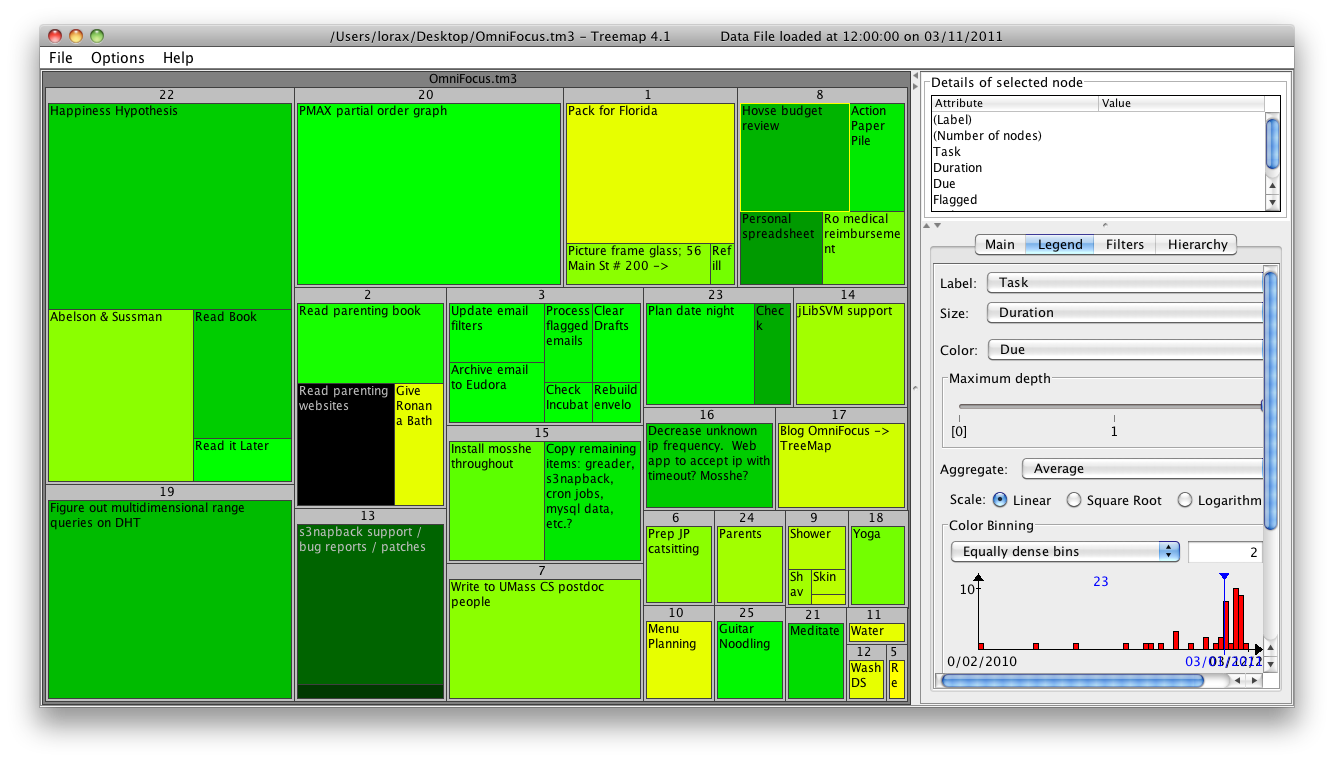
A "treemap" provides a natural visualization for this kind of data, because it can simultaneously represent hierarchical structure (through the 2d layout) and two continuous variables (tile size and color), and guarantees that everything fits on one screen. So, I wanted to visualize my current todo list, grouped by context, with the tile size corresponding to task duration and the color corresponding to the due date (i.e., to see how far overdue something is). Alternatively, one might want to color things based on whether they're flagged or not, or make tile size correspond to urgency in some way instead of duration, etc.
There are various treemap visualization programs available, but as far as I can tell only Treemap 4.1 (by the original inventor of treemaps) is freely available and reads arbitrary data (as opposed to the various disk-space-mapping tools such as DiskInventoryX). To try it out, I wrote a very simple perl script (of2tm3.pl) that translates OmniFocus CSV exports into the tm3 format that Treemap 4.1 can read. Here's an example showing things on my plate today:
In the Treemap program, hovering on a tile shows a tooltip with more detail about that task.
Note that the OmniFocus export function dumps whatever is in the current view, so you can structure the map by project or by context, and filter for due items, flagged items, etc.
Obviously the graphical presentation could be much improved. This visualizer is from 2000-2004, and various more recent treemap programs look a lot better. The translation script does not at the moment map the numerical hierarchy IDs to project/context names, which is why the groupings in the visualization are numbered and not named. But as a proof of concept I was pretty pleased that this was so easy to do.
Providing a view like this within OmniFocus (with live updating, of course) would be awesome in my opinion.

